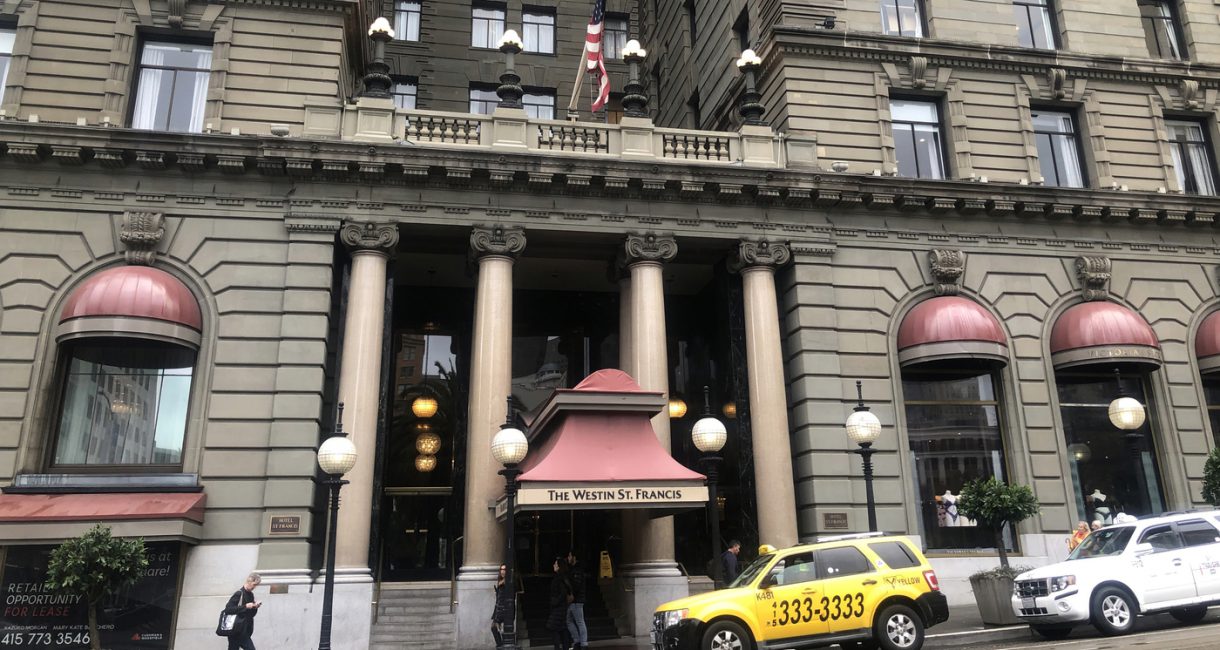
SAN FRANCISCO — Health care’s business class returned to its San Francisco sanctuary last week for JPMorgan’s annual health care confab, at the gilded Westin St. Francis hotel on Union Square. After a two-year pandemic pause, the mood among the executives, bankers and startup founders in attendance had the aura of a reunion — as they gossiped about promotions, work-from-home routines, who’s getting what investments. Dressed in their capitalist best — ranging from brilliant-blue or pastel-purple blazers to puffy-coat chic — they thronged to big parties held in art galleries and restaurants. But the party was tinged with new anxiety: Would the big money invested in health care due to COVID-19 continue to flow? Would investors ask to see results — meaning profits — rather than just cool ideas? The buzzy conference had just as many words about profits as about patients. The mostly maskless crowd spoke English, French, Japanese — and, of course, money. Besides the corporate and investment types, attendees routinely saw surprising characters — like celebrity doctor Mehmet Oz, fresh off his Senate loss, holding court in the lobby on Jan. 10. If the vibe in the hotel’s congested halls was upbeat — or, at least, […]